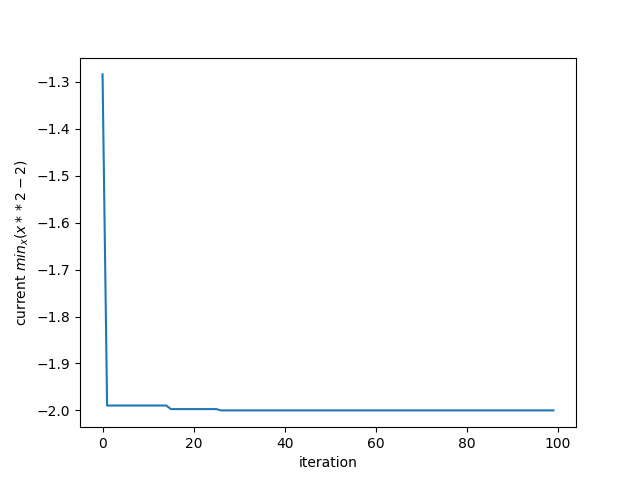
Plotting random search behavior
Show the evolution of the current min with random search
Out:
best input : -0.00, best output : -2.00
from fluentopt import RandomSearch
import numpy as np
import matplotlib.pyplot as plt
from scipy import minimum

np.random.seed(42)


def sampler(rng):
    return rng.uniform(-1, 1)


def feval(x):
    return (x ** 2 - 2)

opt = RandomSearch(sampler=sampler)
n_iter = 100

for _ in range(n_iter):
    x = opt.suggest()
    y = feval(x)
    opt.update(x=x, y=y)

idx = np.argmin(opt.output_history_)
best_input = opt.input_history_[idx]
best_output = opt.output_history_[idx]
print('best input : {:.2f}, best output : {:.2f}'.format(best_input, best_output))
iters = np.arange(len(opt.output_history_))
plt.plot(iters, minimum.accumulate(opt.output_history_))
plt.xlabel('iteration')
plt.ylabel('current $min_x({x**2-2})$')
plt.show()
Total running time of the script: ( 0 minutes 0.069 seconds)