Dict format
An example with usage an input with a dict format.
Out:
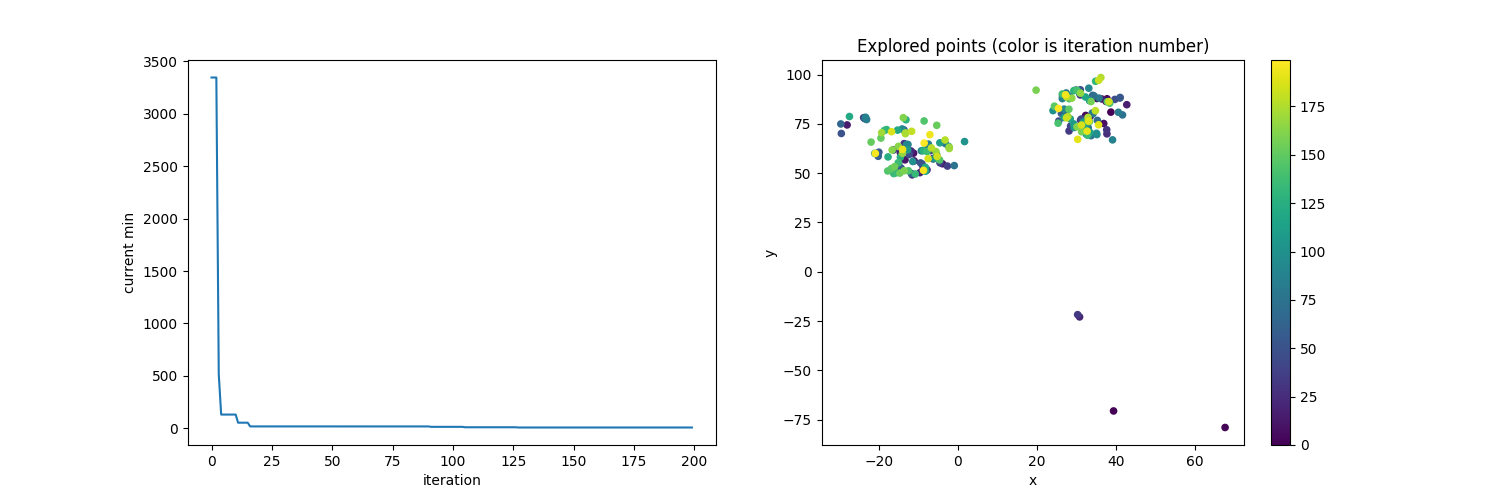
best input : {'b': 58.1415013066466, 'a': -14.604190035269198}, best output : 7.49
import numpy as np
import matplotlib.pyplot as plt
from scipy import minimum

from fluentopt import Bandit
from fluentopt.bandit import ucb_minimize

np.random.seed(42)


def branin(a=1, b=5.1 / (4 * np.pi**2), c=5. / np.pi,
           r=6, s=10, t=1. / (8 * np.pi)):
    """Branin-Hoo function is defined on the square x1 ∈ [-5, 10], x2 ∈ [0, 15].
    It has three minima with f(x*) = 0.397887 at x* = (-pi, 12.275),
    (+pi, 2.275), and (9.42478, 2.475).
    More details: <http://www.sfu.ca/~ssurjano/branin.html>

    This code is adapted from : https://github.com/scikit-optimize/scikit-optimize
    """
    def f(d):
        x, y = d['a'], d['b']
        return (a * (y - b * x ** 2 + c * x - r) ** 2 +
                s * (1 - t) * np.cos(x) + s)
    return f


def sampler(rng):
    return {'a': rng.uniform(-100, 100),
            'b': rng.uniform(-100, 100)}

feval = branin()

opt = Bandit(sampler=sampler, score=ucb_minimize)
n_iter = 200
for _ in range(n_iter):
    x = opt.suggest()
    y = feval(x)
    opt.update(x=x, y=y)

idx = np.argmin(opt.output_history_)
best_input = opt.input_history_[idx]
best_output = opt.output_history_[idx]
print('best input : {}, best output : {:.2f}'.format(best_input, best_output))

fig, (ax1, ax2) = plt.subplots(1, 2, figsize=(15, 5))
iters = np.arange(len(opt.output_history_))
ax1.plot(iters, minimum.accumulate(opt.output_history_))
ax1.set_xlabel('iteration')
ax1.set_ylabel('current min')
X = [[inp['a'], inp['b']] for inp in opt.input_history_]
X = np.array(X)

sc = ax2.scatter(X[:, 0], X[:, 1], c=iters, cmap='viridis', s=20)
ax2.set_xlabel('x')
ax2.set_ylabel('y')
ax2.set_title('Explored points (color is iteration number)')
fig.colorbar(sc)
plt.show()
Total running time of the script: ( 0 minutes 3.553 seconds)